بررسی microRNA ها به عنوان معیارهای حوزه های بیرونی خطر در زمینه ویژگی های ژنتیکی اساسی: دیابت نوع 2 به عنوان مثال

خلاصه
The etiology of most health conditions is complex, arising from a combination of risk factors that include both intrinsic (i.e., genetic characteristics) and extrinsic (e.g., behaviors, the environment, social factors) domains. Until relatively recently, health science research typically conflated the biological construct of genetic ancestry with the social constructs of race and ethnicity. The advent of ancestry informative markers (AIMs) and related statistical methods marked an important advance, enabling the quantification of genetic ancestry independent of the constructs of race and ethnicity. Another type of molecular marker (microRNAs) has shown potential utility for quantifying extrinsic domains of risk, including behavioral, environmental, and social factors, within the context of underlying genetic characteristics. Given these markers offer distinct yet complementary information, combining them may provide a more rigorous and comprehensive approach to evaluating the combined domains of intrinsic genetic risk with extrinsic risk factors to improve accuracy in prediction of risk for complex diseases like type 2 diabetes (T2D).
Introduction
The etiology of most health conditions is complex, arising from both intrinsic (i.e., genetic characteristics) and extrinsic (e.g., behaviors, environment) risk factor domains. As opposed to single gene testing, whole-genome approaches have made it feasible to describe a wider spectrum of inter-individual variability in intrinsic genetic characteristics. These more comprehensive approaches are essential for understanding multifactorial genetic risk for complex conditions (e.g., type 2 diabetes) and related complications. Polygenic risk scores (PRS) that can be derived from genome-wide association studies (GWAS) describe the combined risk from numerous genetic loci, often with small individual effect sizes, and provide an approach to describing overall intrinsic risk for health outcomes for an individual. However, when applied to risk prediction models, PRS provide limited improvement in accuracy compared to models that include only demographic, clinical, and family history characteristics (; ).
محدودیت مستند بسیاری از GWAS های اولیه فقدان نمونه های مطالعاتی است که در سطح جهانی معرف باشند (). این محدودیت پیامدهای مهمی برای مطالعات ارتباط ژنتیکی دارد. ویژگی های ژنتیکی با توجه به اجداد قاره ای جهانی متفاوت است، به طوری که برخی از گونه های ژنتیکی در برخی از گروه ها بیشتر از سایرین وجود دارند. پیامد فقدان بازنمایی اجدادی جهانی در نمونههای مورد مطالعه این است که خطر ژنتیکی برای یک پیامد سلامتی معین فقط برای هاپلوتیپهای اجدادی که در نمونه مورد مطالعه گنجانده شدهاند ثبت میشود. این یک سناریوی “ما نمی دانیم چه چیزی را نمی دانیم” ایجاد می کند، که در آن گیج کننده پنهان باعث می شود برخی افراد به اشتباه به عنوان کم خطر طبقه بندی شوند، فقط به این دلیل که خطر ژنتیکی در زمینه اجدادی آنها ناشناخته است. یک رویکرد برای پرداختن به مشکل آشفتگی نهفته توسط اجداد، تخمین نشانگرهای موروثی است که منشاء جغرافیایی اجدادی را بر اساس مفهوم عدم تعادل پیوندی اندازه گیری می کنند.). ابتدا از طریق پروژه HapMap () و اکنون بیشتر از پروژه 1000 ژنوم (1 کیلوگرم) استفاده می کنند () و دیگر پایگاه های داده مرجع در حال توسعه، نسب فردی را می توان به عنوان یک متغیر کمی برای مدل سازی آماری اندازه گیری و عملیاتی کرد. در مورد یک گروه، نسب مشترک گروهی از افراد را می توان به عنوان زیرساخت جمعیت تعریف کرد.
در حالی که نشانگرهای اجدادی برای استفاده از داده های ژنومی درونی برای ارزیابی ریشه ژنتیکی و خطر بیماری مرتبط مفید هستند، حوزه های بیرونی خطر نیز وجود دارد که به طور قابل توجهی نقش دارند. تا همین اواخر، تحقیقات بهداشتی معمولاً ساختار بیولوژیکی اجداد را با ساختارهای اجتماعی نژاد و قومیت در هم می آمیخت. ظهور نشانگرهای اجداد و روش های آماری برای استفاده از این ویژگی ها با ارائه راهی برای تعیین کمیت اجداد بیولوژیکی جدا از ساختارهای اجتماعی طبقه بندی نژاد و گروه های قومی، این نقص را بهبود بخشید.
بر اساس فناوریهای گسترده ژنوم، اکنون روشهایی برای اندازهگیری میزان بیان ویژگیهای ژنتیکی ثابت در یک فرد و نحوه ارتباط این فرآیندها با خطر پیامدهای سلامتی وجود دارد. این شامل اندازه گیری رونوشت، پروتئوم، متابولوم و اپی ژنوم و غیره است. MicroRNA ها (miRs) مولکول های کوچک (18-24 نوکلئوتیدی) هستند که فرآیند ترجمه RNA پیام رسان (mRNA) را به اسیدهای آمینه تنظیم می کنند.). تنظیم توسط miRها فرآیندی است که توسط آن یک موجود زنده می تواند به سرعت عملکرد فیزیولوژیکی خود را برای بقا در محیط تغییر دهد. تغییرات در سطح بیان miRها در پاسخ به رفتارها و مواجههها در دورههای نسبتاً کوتاهی مشاهده شده است. به عنوان مثال، تغییرات در بیان miR عضلات اسکلتی (به عنوان مثال، miR-1، miR-133، miR-206) قبل و بعد از تست استرس 30 دقیقه ای بر روی تردمیل برای ارزیابی عملکرد قلب استفاده شده است.). علاوه بر این ویژگیهای دینامیکی، miRهای در گردش موجود در خون نسبت به سایر مولکولهای RNA نسبتاً کمتر مستعد تخریب هستند و میتوان آنها را با رگگیری با حداقل تهاجمی استاندارد که به روشهای جمعآوری و ذخیرهسازی تخصصی و پرهزینه نیاز ندارد، به دست آورد، و آنها را نامزدهای امیدوارکنندهای برای ترجمه آینده به عنوان نشانگرهای زیستی خطر بیماری میکند. مطالعات قبلی متعدد در بسیاری از ایالتهای بیماری شواهدی را ارائه کردهاند که نشان میدهد miRs میتواند هم اطلاعات خطر پیشبینیکننده و هم مکانیکی را برای پیامدهای سلامتی، از جمله دیابت نوع 2، که یکی از علل اصلی مرگومیر و عوارض در ایالات متحده و بالاترین اولویت بهداشت عمومی است، ارائه دهد.; ; ; ; ; ; ; ).
با توجه به ویژگیهای دینامیکی و نقش عملکردی آنها در تجلی تعاملات بین ویژگیهای ژنتیکی درونی و عوامل خطر بیرونی، miRs ممکن است فرصتی برای تعیین کمیت تأثیر این تعاملات فراهم کند. برای مثال، miR ها می توانند اطلاعاتی در مورد تأثیر قرار گرفتن در معرض نژادپرستی در زمینه اصل و نسب ژنتیکی ارائه دهند، و این دو ساختار را به عنوان حوزه های جداگانه خطر برای پیامدهای سلامتی متمایز می کنند.). ما فقط یک مطالعه قبلی پیدا کردیم که تفاوتها را در بیان miR بین گروههایی که توسط پسزمینههای ژنتیکی مختلف تعریف شدهاند (گروههای اجدادی) ارزیابی میکرد، که گزارش میداد که 107 miR فردی بهطور متفاوتی بین اجداد یوتانهای اروپای شمالی و غربی (CEU) و نیجریهای یوروبا (YRI) بیان میشدند، که احتمال تفاوتهایی را در بیان miR نشان میدهد که از زیربنای ژنوم مشتق شدهاند.).
هدف این مقاله ارائه دیدگاهی در مورد کاربرد miRs به عنوان نشانگرهای زیستی برای تأثیر تجمعی عوامل خطر برای بیماریهای پیچیده، خلاصه کردن روشهای بالقوه برای ارزیابی الگوهای بیان miR در زمینه اصل و نسب، و نشان دادن چگونگی استفاده از این اطلاعات برای توصیف خطر با استفاده از دیابت نوع 2 به عنوان مثال است. مطالعات آینده میتوانند از امضاهای miR مرتبط با اصل و نسب استفاده کنند تا این حوزه خطر درونی را از مواجهههای بیرونی بالقوه قابل تغییر در یک مدل خطر تجمعی برای بیماریهای پیچیده متمایز کند.
Methods to integrate MiR profiles with genetic ancestry
Given the paucity of studies that have evaluated associations between miR expression and genetic ancestry, consensus about the best approaches for characterizing miR expression profiles in the context of genetic ancestry has yet to be established. Broadly, supervised methods can be employed to describe sets of miRs that are associated with defined ancestral representation, while unsupervised methods can be used to first define observed patterns of miR expression and then determine if they are related to ancestral characteristics. With either approach, pre-processing of miR data based on the assay used for detection will be required (e.g., filtering, normalization, control for batch effects) as well as adjustment for multiple comparisons and internal validation. Methods that might be considered for identifying these miR signatures are briefly described below.
Penalized regression methods, including ridge regression, lasso regression, and elastic net regression, provide a supervised approach for evaluating associations between multiple correlated miRs and measures of genetic ancestry. These methods account for multicollinearity through coefficient penalization, reducing overfitting and improving model stability. Ridge regression shrinks coefficients while retaining all predictors, lasso performs variable selection by shrinking some coefficients to zero, and elastic net combines both approaches for correlated predictors. These methods can be applied using either continuous or categorical measures of genetic ancestry to identify ancestry-associated miR signatures.
Canonical linear discriminant analysis (CLDA) identifies linear combinations of miRs, known as linear discriminants, that provide the best separation between predefined ancestral groups. By reducing multiple correlated miRs into a smaller number of discriminant functions, CLDA can improve classification efficiency while facilitating interpretation of miR patterns associated with discrete ancestry categories.
Hierarchical clustering is an unsupervised method that groups participants based on similarities in miR expression patterns without requiring predefined ancestry categories. The resulting clusters can subsequently be evaluated for associations with continuous measures of genetic ancestry or categorical ancestry groups to determine whether distinct miR expression patterns correspond to underlying genomic characteristics.
Consensus clustering is an unsupervised approach that evaluates the stability of participant clusters across repeated resampling procedures. Following feature reduction to remove low variance miRs, consensus clustering identifies stable patterns of miR expression and provides metrics to guide selection of the optimal number of clusters. Participant cluster membership can then be tested for associations with categorical ancestry groups or continuous measures of genetic ancestry.
Principal component analysis (PCA) reduces the dimensionality of correlated miR predictors by combining them into a smaller number of principal components. In supervised PCA, outcome information (e.g., population substructure) is incorporated during component construction to improve prediction, whereas unsupervised PCA derives components solely from variation in miR expression. Component loadings can subsequently be examined to determine the relative contribution of individual miRs, and the resulting components can be tested for associations with genetic ancestry and other extrinsic factors.
Exemplar study
Design and methods
We leveraged data from our prior study that evaluated miR expression in a subset (n = 854) of participants from the Diabetes Prevention Program (DPP) trial (; برای ارزیابی ارتباط بین miRs و اصل و نسب ژنتیکی در افراد در معرض خطر دیابت نوع 2. نقطه پایانی اولیه کارآزمایی DPP دیابت نوع 2 در 2 سال بود. ویژگی های نمونه کامل، طراحی آزمایشی و روش ها در انتشارات قبلی به تفصیل آمده است (; تمام دادههای گزارششده در اینجا از بازدید ثبتنام اولیه برای آزمایش DPP جمعآوری شد. دادههای MiR از پلاسما با پیروی از پروتکل سازنده با استفاده از سنجش MicroRNA در گردش Multiplex Firefly Bioworks جمعآوری شد.) و از طریق یک مخزن داده قابل دسترسی هستند (به طور خلاصه، 58 miR از پلاسمای تلفیقی بر اساس دادههای اولیه اندازهگیری شد و با پیروی از دستورالعملهای سازنده، اقدامات فیلترینگ کنترل کیفیت شامل سطوح بیان >gt؛ 2 برابر حد پایین تشخیص (58 miRs حفظ شد). بیان miR> 0 در> 90٪ نمونه ها (35 miRs حفظ شد). و miRs با > 80% میانگین انحراف مطلق (28 miRs حفظ شد). داده های ژنتیکی نمونه از طریق دسترسی کنترل شده به dbGaP (شماره دسترسی phs000681.v2.p1) به دست آمد.
ADMIXTURE (Version 1.3.0) was used to derive individual-level proportions of ancestry, leveraging genotype data aligned with 1 KG reference populations (بسته ggplot2 (R, 2022) برای تجسم نسبت های اجدادی به عنوان نمودارهای نواری مرتب شده برای تخمین نسب در سطح فردی و جمعیت استفاده شد.; ; ; ).
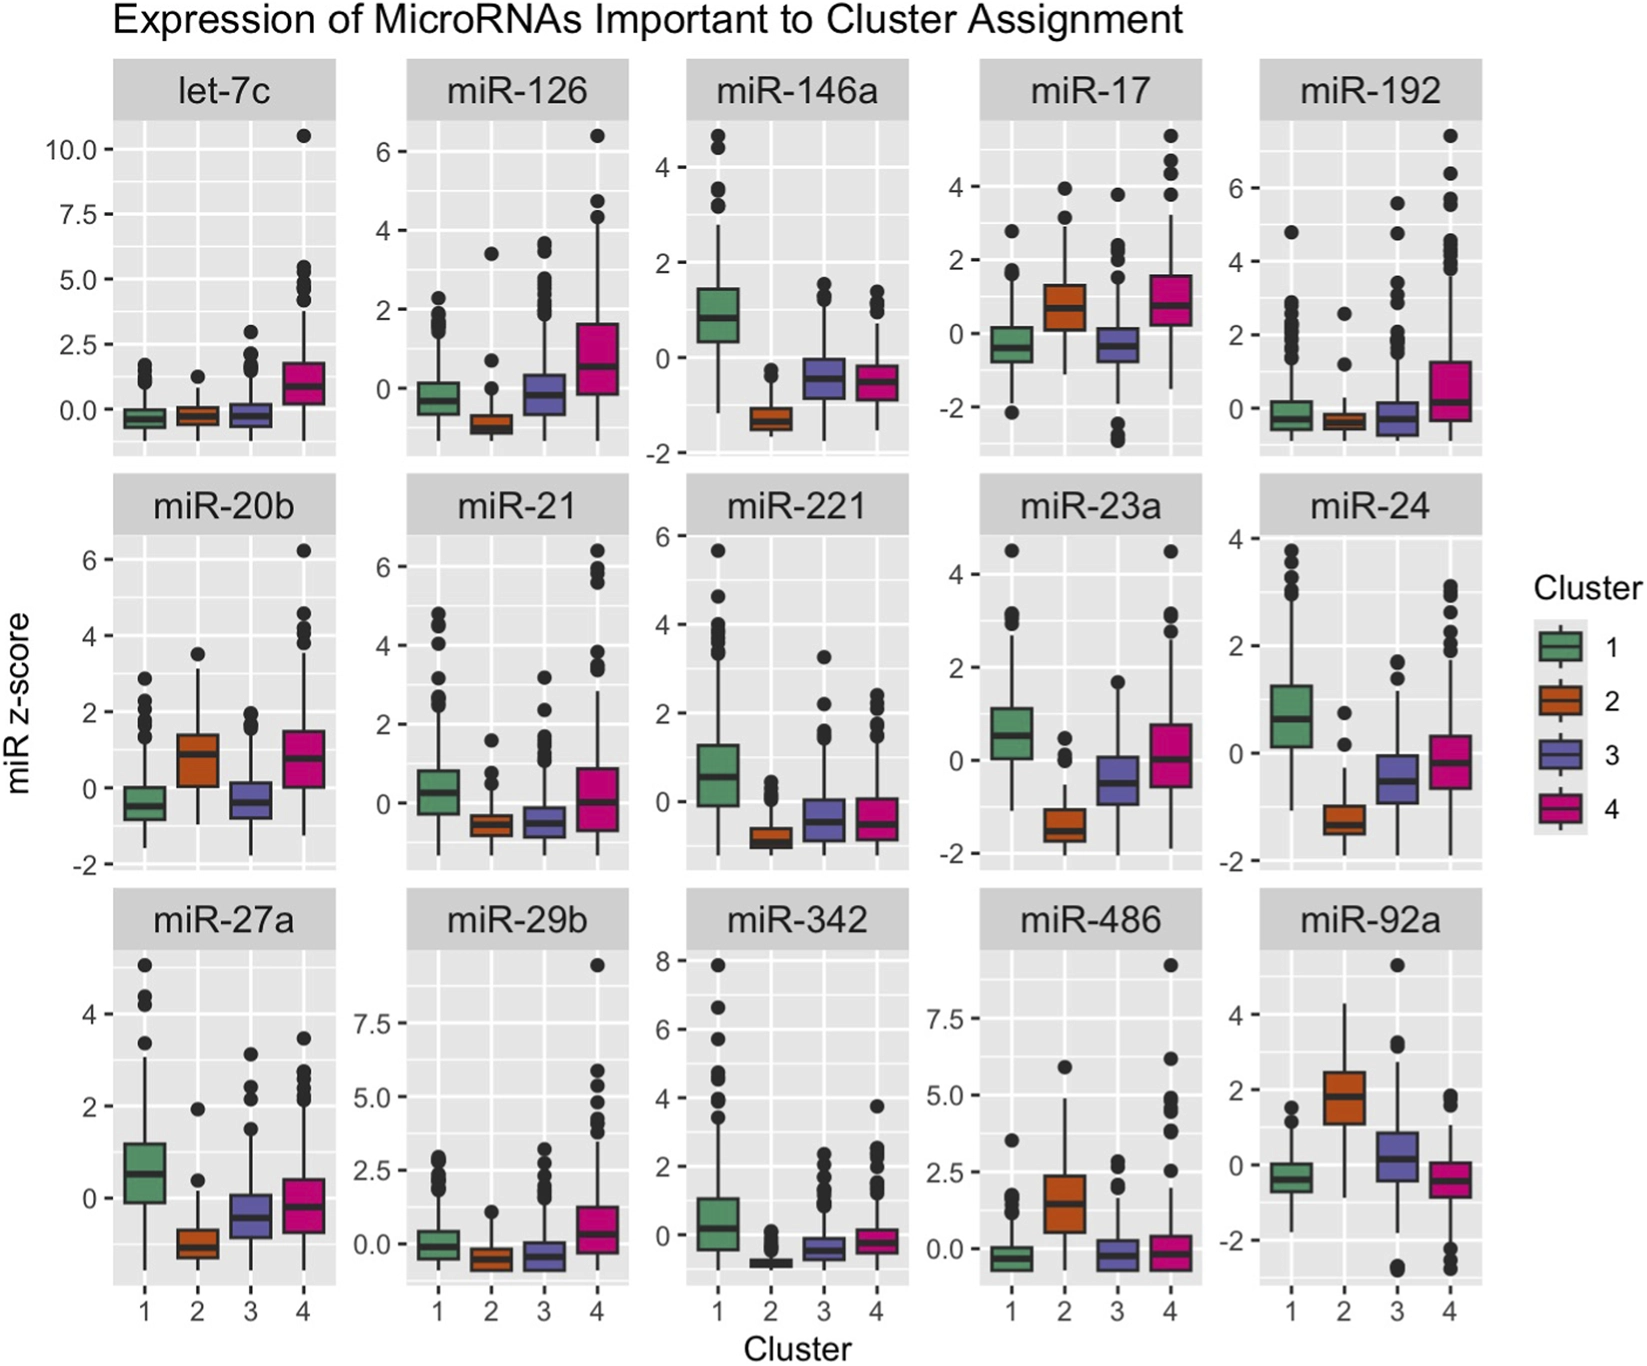
To illustrate one potential analytical workflow, we applied unsupervised k-means consensus clustering to identify miR expression patterns before analyzing their association with measures of genetic ancestry. Prior to analysis, all miR values were standardized using z-scores. Optimal cluster count across k = 1 through k = 5 was evaluated by consensus matrices, cumulative distribution functions, delta area plots, and item tracking plots, and optimal number of clusters was determined based on the most favorable number across these metrics. Random forest models were then used to determine the relative importance of individual miR expression in determining assignment to each cluster. All cluster analyses were performed using R (2023).
Histograms of proportion ancestry were visually assessed to determine normality of distribution. Differences in ancestry proportions between miR clusters were assessed with Kruskal–Wallis test with adjustment for multiple comparisons by the Bonferroni method. Cox proportional hazards models adjusted for trial arm were used to test for associations between ancestry and incident type 2 diabetes over 2-years.
Results
Based on similar cross-validation (cv) error values for k = 5 (cv = 0.56) and k = 8 (cv = 0.56) and to facilitate mapping to the 1 KG super-populations in this exploratory analysis, we retained five ancestral groups that characterize this sample. These mapped to European (k = 4), African (k = 2), Amerindigenous (k = 1), East Asian (k = 3) and South Asian (k = 5).
A total of 28 miRs were included in consensus clustering. Based on evaluation of cluster counts across all metrics, we selected k = 4 clusters (average consensus cluster score 0.89). Expression of miRs 146a, 24, 221, 23a, 342, 27a, 92a, 486, 20b, 21, 17, 126,7c, 29b, and 192 were most important in determining cluster assignment (Figure 1).اروپایی (p Figure 2).
برای خوشههای اجماع miR، تفاوت معنیداری در بروز دیابت نوع 2 در 2 سال وجود نداشت، اما در میان گروههایی که با مداخلات کاهش خطر درمان شدند و تفاوتهای قابلتوجهی در بروز دیابت نوع 2 در 2 سال نسبت به دارونما نشان دادند، خوشه 1 با افزایش شانس همراه بود (OR 3.06 (1.10، OR، 9.88، کاهش در گروه مداخله). 0.43 (0.18، 0.97)) در گروه دارو. هیچ یک از دو اصل و نسب به طور قابل توجهی با بروز دیابت نوع 2 در طول 2 سال مرتبط نبودند.
Discussion
Health science research has historically conflated race and ethnic categories with continental genetic ancestry. While these two constructs are related and sometimes correlated, they are distinct. This is evidenced by the more complex and continuous biological genetic structure as compared to discrete socially defined categories of race and ethnicity, the latter of which is how most study samples have previously been characterized. Among many major contributions, the Human Genome Project facilitated measurement of genetic ancestry using AIMs based on the principle of linkage disequilibrium, and newer technologies now capture an even broader spectrum of ancestry-linked genetic variation. This presents the opportunity to control for continuous genetic ancestry, which is representative of individual differences in background genetic variation, including loci that may be associated with disease risk. This is distinct from socially assigned race and ethnic groups that may function as a proxy for social experiences that affect disease risk; however, within these groups, there is still significant heterogeneity in extrinsic exposures and risk for type 2 diabetes. There remains the major challenge of measuring the biological impact of heterogeneous social experiences. MiRs exhibit dynamic expression and have the potential to overcome existing challenges by providing a method to quantify the biological consequences of extrinsic factors that may affect disease risk. However, miRs are encoded by the underlying genome, and are likely to show differences in presence and function based on individual genetic characteristics, including ancestry. Our prior study in this same sample showed that miRs are significant predictors of incident type 2 diabetes (، از این ایده حمایت می کند که آنها خطر ناشی از عوامل ژنتیکی و بیرونی را مشخص می کنند. ما فرض میکنیم که miRs ممکن است راهی برای تشخیص خطر ژنتیکی درونی برای بیماریهای مرتبط با اصل و نسب ژنتیکی از مناطق خطر خارجی مرتبط با نژاد و قومیت باشد.
ما فقط دو مطالعه قبلی را شناسایی کردیم (; )، از جمله مجموعه دادههای ما از همان مجموعه دادههای شرکتکنندگان در کارآزمایی DPP، که به تفاوتهای بیان miR بین نژاد و گروههای قومی نگاه میکرد تا تعیین کند که آیا ساختار نژاد و تجارب اجتماعی مرتبط ممکن است بر الگوهای بیان miR تأثیر بگذارد. با این حال، هیچ یک از مطالعات نسب ژنتیکی را کنترل نکرد تا تأثیر متمایز تجربه اجتماعی را از شیوع مکانهای ژنتیکی مرتبط با خطر بیماری جدا کند. همانطور که در مقاله قبلی ما مشخص شد () فقدان کنترل برای این ویژگی های اساسی اجدادی ممکن است یکی از دلایل عدم اعتبار سنجی و تعمیم ناکافی یافته های تحقیق در سراسر مطالعات باشد.
این مطالعه نمونه ترکیبی را در نمونه مورد مطالعه نشان داد که از سراسر ایالات متحده به کار گرفته شده بود، با بازنمایی نسبتاً کمتری از گروههای اجدادی که به مناطق آمریکا، آسیای شرقی و جنوب آسیا نقشهبرداری میکنند. تفاوت هایی در نسبت اجداد اروپایی و آفریقایی در خوشه های miR وجود داشت (Figure 2). این از این ایده حمایت می کند که اصل و نسب با الگوهای بیان miR مرتبط است که تا حدی تحت تأثیر جایگاه های ژنتیکی و چندشکلی های زیرین قرار دارند. هر فرد دارای ویژگی های miR خاصی است که توسط ژنوم زیرین آنها از پیش تعریف شده است و این ویژگی ها تا حدی توسط خوشه های اجماع miR نشان داده می شوند. با این حال، تنوع در بازنمایی نسبت اجدادی بین خوشههای miR نیز از این فرضیه پشتیبانی میکند که miRها پتانسیل جذب عواملی از حوزههای خطر خارجی، از جمله نژاد و گروههای قومی تعریفشده اجتماعی را دارند که بر ویژگیهای ژنتیکی زیربنایی قرار میگیرند. ارتباط افتراقی بین خوشههای miR و دیابت شایع نوع 2 در میان شرکتکنندگانی که با مداخلات کاهش خطر رفتاری و دارویی درمان شدهاند، بیشتر از این پتانسیل حمایت میکند که miRها نشانگرهای زیستی نامزدی هستند که میتوانند ناهمگونی سطح فردی در خطر را در پاسخ به عوامل خارجی نشان دهند.
داده های ارائه شده در این مقاله برای نشان دادن اثبات مفهوم و محدودیت هایی در نظر گرفته شده است. پایگاه داده مرجع شجره 1 کیلوگرم نماینده همه گروه های اجدادی نیست، و نمونه ما همچنین دارای نمایش محدودی از برخی اجداد (به عنوان مثال، بومیان آمریکا، آسیای شرقی، جنوب آسیا) بود، که ممکن است قدرت محدودی برای آزمایش تفاوت در نسبت ها داشته باشد. نمونه به افراد مبتلا به پیش دیابت در مقایسه با طیف کامل خطر دیابت محدود بود و قدرت آزمایش ارتباط با نتیجه بیماری پیچیده را کاهش داد. رویکردهای خوشهبندی miR بهینه ایجاد نشدهاند و مطالعات آینده برای مقایسه عملکرد روشهای ارائهشده در بالا و در Supplementary Table S1. ما پیشنهاد می کنیم که ترکیبی از نشانگرهای ارثی برای ارزیابی اصل و نسب ژنتیکی در ترکیب با miR ها، که به راحتی در گردش خون محیطی قابل تشخیص هستند و قبلاً نشان داده شده است که تغییرات دینامیکی در پاسخ به عوامل خطر بیرونی دارند، ممکن است به طراحی مطالعاتی کمک کند که می توانند با دقت بیشتری روابط علّی بین پاسخ های ذاتی و نسبتاً ژنتیکی را ارزیابی کنند. عوامل بیرونی که در طول زمان پویا هستند. مطالعات آینده میتواند شامل معیارهای نسب با امتیازهای چند ژنی و miR باشد تا مشخص شود که آیا این دقت پیشبینی خطر را بهبود میبخشد و در این مدلها، تعیین میکند که آیا miRs خطر بیرونی را جذب میکند یا خیر. با اندازههای نمونه بزرگتر، نمرات خطر چند ژنی و miR خاص اجداد نیز قابل آزمایش هستند. کاربرد نهایی این روشهای مولکولی و آماری بهبود دقت پیشبینی خطر برای بیماریهای پیچیده مانند دیابت نوع 2 و توصیف ترکیبی از مواجهههای درونی و بیرونی است که ممکن است اهداف مکانیکی برای کاهش خطر باشند.
Statements
Ethics statement
The studies involving humans were approved by University of California, San Francisco. The studies were conducted in accordance with the local legislation and institutional requirements. The participants provided their written informed consent to participate in this study.
سهم نویسنده
BS: Writing – original draft, Writing – review and editing, Formal Analysis, Methodology, Visualization. AJ: Writing – review and editing, Formal Analysis, Visualization. KLi: Methodology, Writing – review and editing, Supervision. DT: Writing – review and editing, Methodology, Supervision. KLo: Visualization, Writing – review and editing. JI-E: Methodology, Supervision, Writing – review and editing. EF: Funding acquisition, Writing – original draft, Supervision, Methodology, Conceptualization, Resources, Data curation, Investigation, Writing – review and editing, Project administration.
تامین مالی
The author(s) declared that financial support was received for this work and/or its publication. This study was supported by the National Institute for Diabetes, Digestive and Kidney Disease grant number R01DK124228. Biospecimens used in this study were provided under approval X01DK115999. EF is supported by National Institute for Diabetes, Digestive and Kidney Disease grant number K26DK137286. The Diabetes Prevention Program (DPP) was conducted by the DPP Research Group and supported by the National Institute of Diabetes and Digestive and Kidney Diseases (NIDDK), the General Clinical Research Center Program, the National Institute of Child Health and Human Development (NICHD), the National Institute on Aging (NIA), the Office of Research on Women’s Health, the Office of Research on Minority Health, the Centers for Disease Control and Prevention (CDC), and the American Diabetes Association. The data and biospecimens from the DPP were supplied by the NIDDK Central Repository. This manuscript was not prepared under the auspices of the DPP and does not represent analyses or conclusions of the DPP Research Group, the NIDDK Central Repository, or the NIH.
تضاد منافع
The author(s) declared that this work was conducted in the absence of any commercial or financial relationships that could be construed as a potential conflict of interest.
بیانیه تولید هوش مصنوعی
The author(s) declared that generative AI was not used in the creation of this manuscript.
Any alternative text (alt text) provided alongside figures in this article has been generated by Frontiers with the support of artificial intelligence and reasonable efforts have been made to ensure accuracy, including review by the authors wherever possible. If you identify any issues, please contact us.
یادداشت ناشر
All claims expressed in this article are solely those of the authors and do not necessarily represent those of their affiliated organizations, or those of the publisher, the editors and the reviewers. Any product that may be evaluated in this article, or claim that may be made by its manufacturer, is not guaranteed or endorsed by the publisher.
References
-
AlimenaS.StephensonB. J. K.WebberJ. W.WollbornL.SussmanC. B.PackardD. G.et al (2024). Differences in serum miRNA profiles by race, ethnicity, and socioeconomic status: implications for developing an equitable ovarian cancer screening test. Cancer Prev. Res. (Phila)17 (4) 177—185. 10.1158/1940-6207.CAPR-23-0156
-
AsamK.LewisK. A.KoberK.GongX.KanayaA. M.AouizeratB. E.et al (2023). Multi-tiered assessment of gene expression provides evidence for mechanisms that underlie risk for type 2 diabetes. Diabetes Metab. Syndr. Obes.16، 3445—3457. 10.2147/DMSO.S428572
-
Diabetes Prevention Program (DPP) Research Group (2002). The diabetes prevention program (DPP): description of lifestyle intervention. Diabetes Care25 (12) 2165—2171. 10.2337/diacare.25.12.2165
-
FatumoS.ChikoworeT.ChoudhuryA.AyubM.MartinA. R.KuchenbaeckerK. (2022). A roadmap to increase diversity in genomic studies. Nat. Med.28 (2) 243—250. 10.1038/s41591-021-01672-4
-
FlannickJ.FlorezJ. C. (2016). Type 2 diabetes: genetic data sharing to advance complex disease research. Nat. Rev. Genet.17 (9) 535—549. 10.1038/nrg.2016.56
-
FlowersE. (2024). DPP MicroRNAs. Harv. Dataverse. 10.7910/DVN/MJDBJE
-
FlowersE.FroelicherE. S.AouizeratB. E. (2013). Measurement of MicroRNA: a regulator of gene expression. Biol. Res. Nurs.15 (2) 167—178. 10.1177/1099800411430380
-
FlowersE.WonG. Y.FukuokaY. (2015). MicroRNAs associated with exercise and diet: a systematic review. Physiol. Genomics47 (1) 1—11. 10.1152/physiolgenomics.00095.2014
-
FlowersE.AllenI. E.KanayaA. M.AouizeratB. E. (2021). Circulating MicroRNAs predict glycemic improvement and response to a behavioral intervention. Biomark. Res.9 (1) 65. 10.1186/s40364-021-00317-5
-
FlowersE.AsamK.AllenI. E.KanayaA. M.AouizeratB. E. (2022a). Co-expressed microRNAs, target genes and pathways related to metabolism, inflammation and endocrine function in individuals at risk for type 2 diabetes. Mol. Med. Rep.25 (5) 156. 10.3892/mmr.2022.12672
-
FlowersE.KanayaA. M.ZhangL.AouizeratB. E. (2022b). The role of racial and ethnic factors in MicroRNA expression and risk for type 2 diabetes. Front. Genet.13، 853633. 10.3389/fgene.2022.853633
-
FlowersE.AouizeratB. E.KanayaA. M.FlorezJ. C.GongX.ZhangL. (2023). MicroRNAs associated with incident diabetes in the diabetes prevention program. J. Clin. Endocrinol. Metab.108 (6)، e306–e312. 10.1210/clinem/dgac714
-
FlowersE.StroebelB.LewisK. A.AouizeratB. E.GadgilM.KanayaA. M.et al (2024). Longitudinal associations between microRNAs and weight in the diabetes prevention program. Front. Endocrinol. (Lausanne)15، 1419812. 10.3389/fendo.2024.1419812
-
Genomes Project ConsortiumAutonA.BrooksL. D.DurbinR. M.GarrisonE. P.KangH. M.et al (2015). A global reference for human genetic variation. Nature526 (7571) 68—74. 10.1038/nature15393
-
HuangR. S.GamazonE. R.ZiliakD.WenY.ImH. K.ZhangW.et al (2011). Population differences in microRNA expression and biological implications. RNA Biol.8 (4) 692—701. 10.4161/rna.8.4.16029
-
International HapMap Consortium (2003). The international HapMap project. Nature426 (6968) 789—796. 10.1038/nature02168
-
KariukiD.AouizeratB. E.AsamK.KanayaA. M.ZhangL.FlorezJ. C.et al (2023). MicroRNA biomarkers target genes and pathways associated with type 2 diabetes. Diabetes Res. Clin. Pract.203 (110868) 110868. 10.1016/j.diabres.2023.110868
-
LewisK. A.StroebelB. M.ZhangL.AouizeratB.MattisA. N.FlowersE. (2024). MicroRNAs associated with metformin treatment in the diabetes prevention program. Int. J. Mol. Sci.25 (11) 5684. 10.3390/ijms25115684
-
Padilla-MartínezF.CollinF.KwasniewskiM.KretowskiA. (2020). Systematic review of polygenic risk scores for type 1 and type 2 diabetes. Int. J. Mol. Sci.21 (5) 1703. 10.3390/ijms21051703
-
StroebelB. M.GadgilM.LewisK. A.LongoriaK. D.ZhangL.FlowersE. (2025). Body composition differentiates prediabetes phenotype clusters in the diabetes prevention program study. J. Clin. Endocrinol. Metab. 110 (11)، e3665–e3672. 10.1210/clinem/dgaf163
-
The Diabetes Prevention Program Research Group (2000). The diabetes prevention program: baseline characteristics of the randomized cohort. The diabetes prevention program research group. Diabetes Care23 (11) 1619—1629. 10.2337/diacare.23.11.1619
-
YangN.LiH.CriswellL. A.GregersenP. K.Alarcon-RiquelmeM. E.KittlesR.et al (2005). Examination of ancestry and ethnic affiliation using highly informative diallelic DNA markers: application to diverse and admixed populations and implications for clinical epidemiology and forensic medicine. Hum. Genet.118 (3-4) 382—392. 10.1007/s00439-005-0012-1
خلاصه
Keywords
disease etiology, genetic admixture, microRNAs, risk prediction, social determinants of health
Citation
Stroebel BM, Jimenez A, Lindquist KJ, Torgerson D, Longoria KD, Ignacio-Espinoza JC and Flowers E (2026) Considering microRNAs as measures of extrinsic domains of risk in the context of underlying genetic characteristics: type 2 diabetes as an exemplar. در جلو. متاهل 17:1934355. doi: 10.3389/fgene.2026.1934355
Published
18 September 2026
Reviewed by
Woo Jun Shim، دانشگاه کوئینزلند، استرالیا
Updates
Check for updates
حق چاپ
© 2026 Stroebel، Jimenez، Lindquist، Torgerson، Longoria، Ignacio-Espinoza و Flowers.
This is an open-access article distributed under the terms of the Creative Commons Attribution License (CC BY). استفاده، توزیع یا تکثیر در انجمنهای دیگر مجاز است، مشروط بر اینکه نویسنده (ها) اصلی و صاحب (ها) حق چاپ تایید شده باشند و طبق رویه دانشگاهی پذیرفته شده، به انتشار اصلی در این مجله استناد شود. هیچ گونه استفاده، توزیع یا تولید مثلی که با این شرایط مطابقت نداشته باشد مجاز نیست.
*Correspondence: Elena Flowers, elena.flowers@ucsf.edu
سلب مسئولیت
تمام اظهارات بیان شده در این مقاله به تنهایی متعلق به نویسندگان است و لزوماً بیانگر اظهارات سازمان های وابسته به آنها یا ناشر، ویراستاران و داوران نیست. هر محصولی که ممکن است در این مقاله ارزیابی شود یا ادعایی که ممکن است توسط سازنده آن باشد، توسط ناشر تضمین یا تایید نمی شود.